


Surfactant concentration measurements of longitudinal interfacial waves
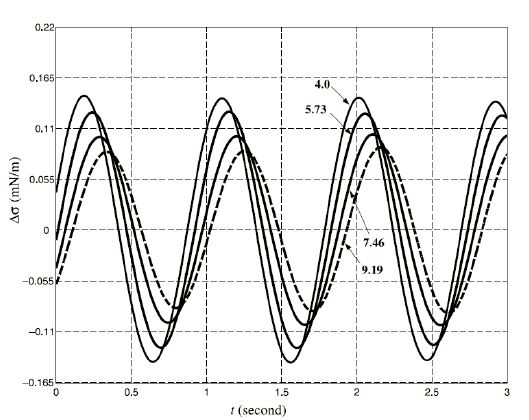
Figure 1
Click image to enlarge
The presence of surfactant at the air-water interface has a significant effect on a wide variety of flows. Due to the presence of velocity components parallel to the surface in these flows, longitudinal waves are most likely present in these flows. Because longitudinal waves are characterized by motion only in the plane of the surface, they are very difficult to measure in many real-world flows. The behavior of these waves is highly dependent on viscoelastic surfactant properties of the fluid and comparison between experimentally measured waves and theory allows for study of the physics of this phenomenon. Therefore, non-intrusive measurements of local, instantaneous surfactant concentration are desired.
Fig. 1: Surface tension vs. time at various positions downstream from the wave generator.
Fig. 2: An example of longitudinal waves with particle displacement parallel to the direction of propagation. (http://www.acs.psu.edu/drussell/demos/waves/wavemotion.html)
The experiments are carried out in a 72cm long by 18cm wide glass tank. Waves were generated by a rigid barrier barely touching the surface moving along the length of the tank. The barrier oscillates at an amplitude of 2mm with frequency ranging from 0.1 to 1 Hz. Laser light hits the surface of the water at an angle of 30 degrees with respect to horizontal and the reflected beam contains both reflected green and its second harmonic in the UV range(See Figure 3). The local, instantaneous concentration of surfactant is proportional to the ratio of reflected UV and incident green light.
Fig. 3: An end view of the experimental setup where green laser light hits the surface of the water at an incident angle and the detector measures the intensity of reflected UV light.
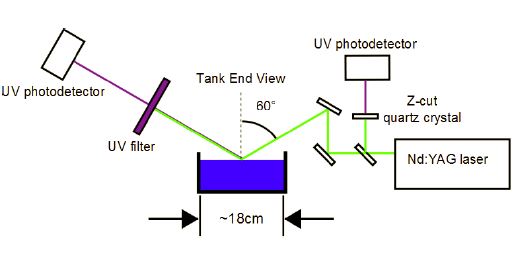
Figure 3
Click image to enlarge
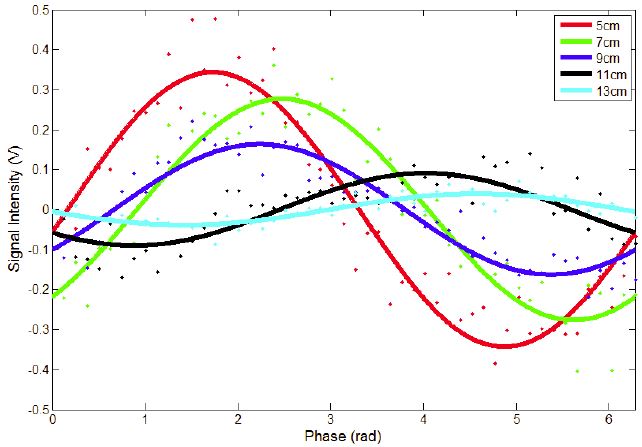
Figure 4
Click image to enlarge
Figure 4 shows the intensity of UV light for various positions downstream of the wave generator. These intensities are then phase averaged and fitted to sinusoidal functions. The phase and amplitude vs. position downstream are then plotted. As seen in Figure 5, the wavenumber and decay rate can be determined by tracking the phase shift and amplitude of the signal as a function of downstream position. These measured quantities can be used, along with the linear theory, to determine viscoelatic surfactant properties of the fluid, such as Gibbs elasticity, surface excess viscosity, and the surface-to-bulk diffusion parameter.
Fig. 4: Results from phase averaging of UV signal intensity at different position downstream from wave generator.
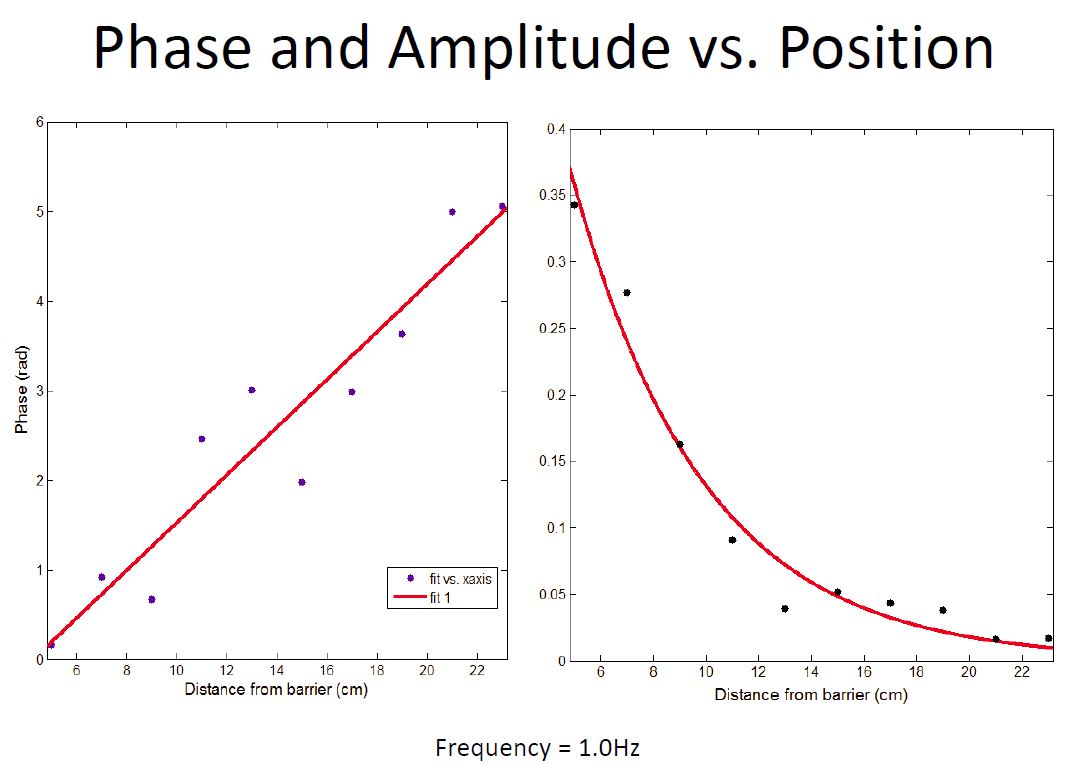
Fig. 5: Phase and amplitude vs. position from wave generator plots.
Click image to enlarge