

Free-Surface Turbulent Couette Flow
Turbulent Couette Flow in the presence of a free surface is an important canonical flow in the study and understanding of the interaction of shear flows and the free surface. This flow provides an important test case for understanding free-surface fluctuations and air entrainment processes. In this experiment, a stationary plastic plate is introduced at a set distance from the SBL moving belt in the towing tank facility and the belt is run at constant speed.
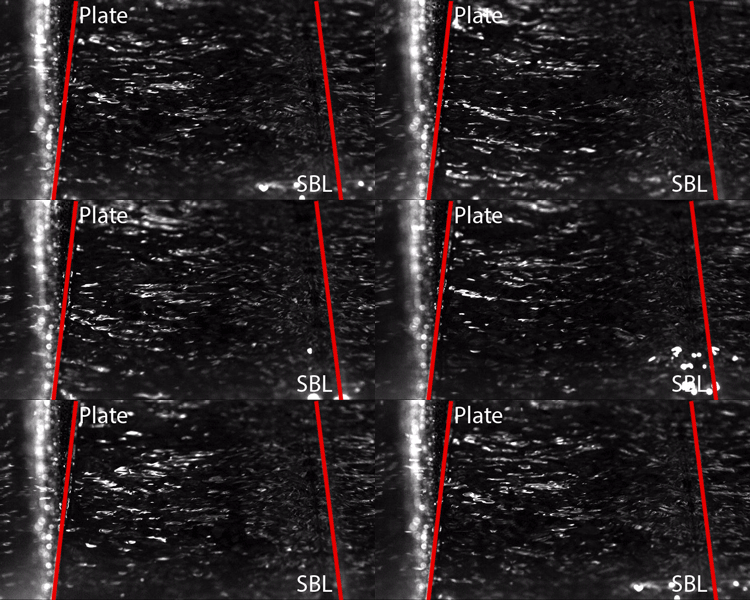
Fig. 1: Movie of the free surface between the SBL and the stationary plate. Filmed under white light.
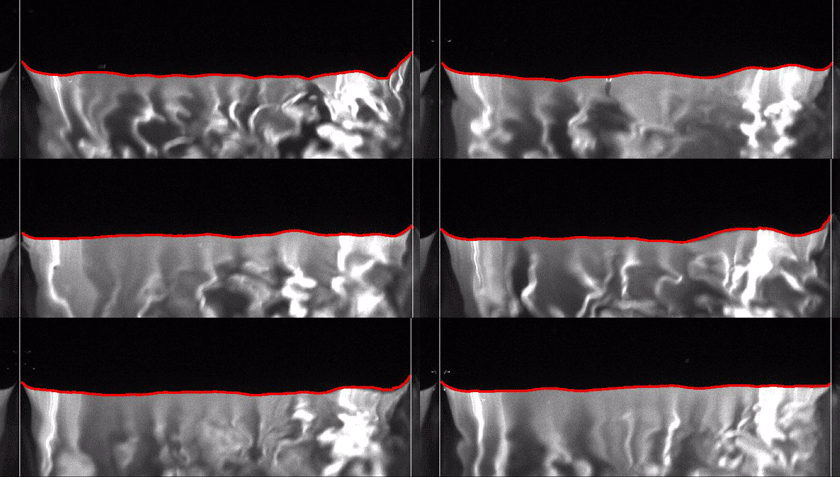
Fig. 2: An example of processed surface profiles for V = 3.0 m/s, Re = 2.24e5 and Fr = 1.9. The red line is the free surface boundary.
Click image to enlarge
In order to measure instantaneous surface profiles, Laser-Induced Fluorescence (LIF) is used. In this measurement technique, a light sheet is introduce onto the water surface from above, illuminating the water surface in a line normal to the walls of the couette flow experiment. The water is mixed with fluorescent dye so that the intersection of the laser sheet with the free surface appears as a bright line. This location at the water surface is recorded with high-speed movie cameras in order to measure these surface profiles throughout time.
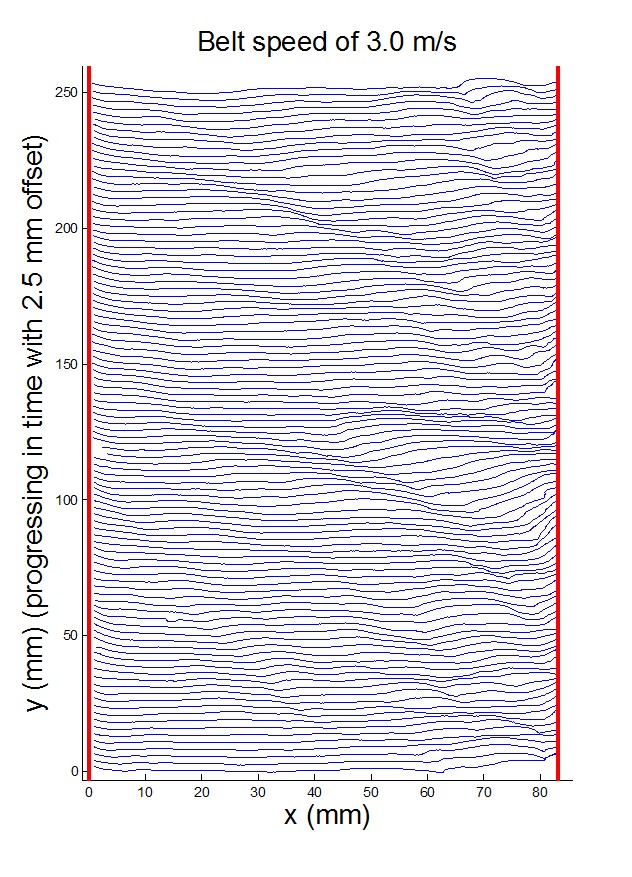
Fig. 3: Time history of free surface profiles at 3 m/s. Each profile is shifted vertically in order to reduce overlap and show the progression of features in time.
Figure 3
Click image to enlarge

Figure 4
Click image to enlarge
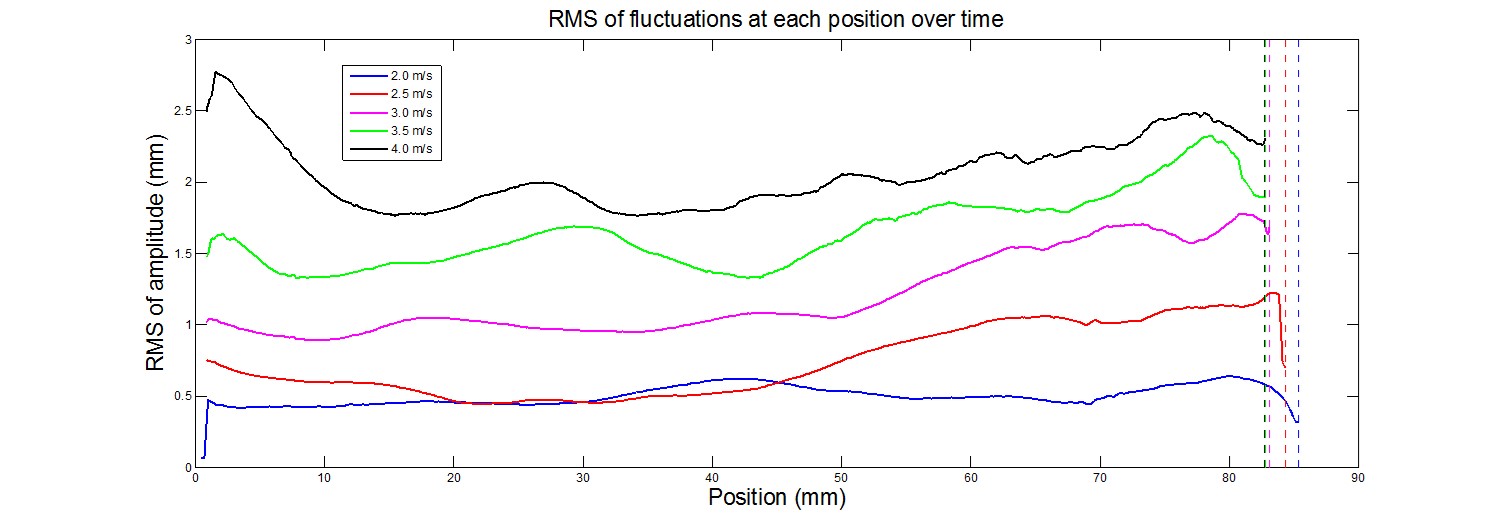
Figure 5 shows the root-mean-square (RMS) velocity fluctuations at each cross-stream position for five different belt speeds. From this figure it can be seen that the RMS surface height increases with belt speed and height fluctuations reach a maximum at a small distance from the belt.
Fig. 4: RMS wave profiles for 5 different velocities.


